SpinConnect 2.0
Redefining Smart Textile Manufacturing with UX-Driven Intelligence
Client
Lakshmi Mills
Services
Research, Strategy, Design
Industry
Iot
Platform
Web
SpinConnect 2.0 is a web-based smart monitoring and control application that digitally transforms the entire spinning process—from Blow Room to Winder. By capturing key operational parameters like Speeds, Production Stoppages, Quality, and Power Consumption, it enables manufacturers to gain real-time insights, enhance plant utilization, and drive productivity.
Through an experience-first UX approach, we designed an intuitive, data-rich, and actionable platform that empowers factory managers, technicians, and decision-makers to monitor, analyze, and optimize operations effortlessly.
The Challenge
Traditional textile monitoring systems were plagued by:
Scattered, hard-to-read data leading to inefficient decision-making.
Complex, non-intuitive dashboards that made process monitoring difficult.
Lack of real-time insights to prevent breakdowns and optimize productivity.
Limited accessibility making remote monitoring a challenge.
Our goal was to design a seamless, visually intuitive, and efficient user experience that allows users to access critical data effortlessly, take proactive actions, and optimize performance in real time.
Our UX Design Process
User Research & Industry Insights
Understanding the needs of factory managers, supervisors, and technicians was key to building an efficient system. We conducted:
On-site observations to analyze how textile plants monitor and control production.
Stakeholder interviews with decision-makers, operators, and maintenance teams.
Competitor benchmarking to evaluate existing monitoring solutions and gaps.
The research revealed a strong need for an easy-to-use, real-time, and mobile-friendly interface that simplifies decision-making without overwhelming the user.
Experience Mapping & Information Architecture
To transform complex industrial data into actionable insights, we focused on:
Streamlining navigation to ensure users can quickly access key metrics.
Designing modular dashboards to present only the most relevant data for each role.
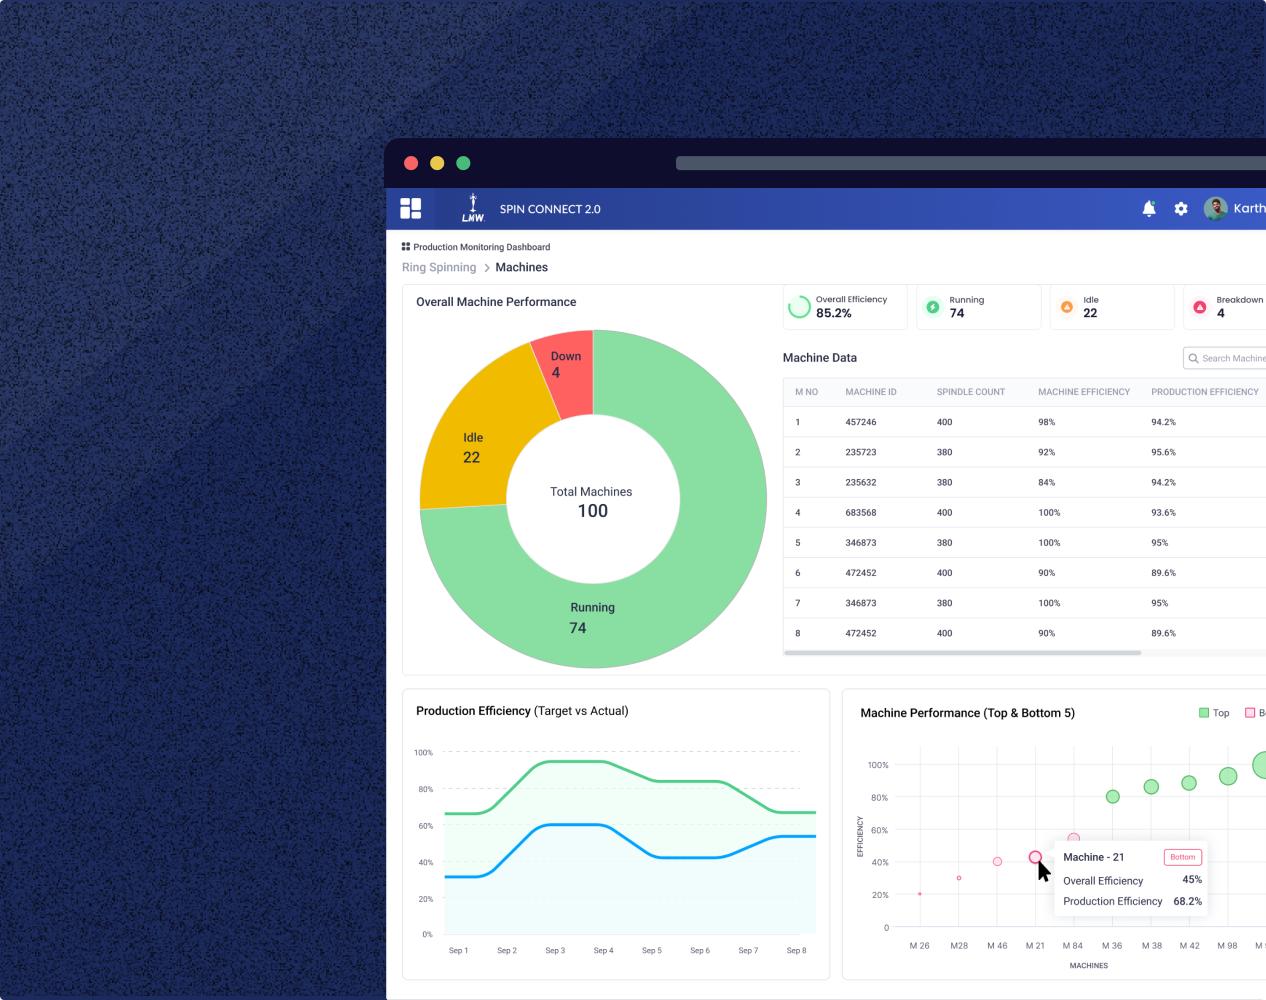
Optimizing data visualization through clear charts, graphs, and real-time alerts.
By simplifying data-heavy interfaces, we ensured that users could easily interpret performance metrics, diagnose issues, and act instantly.
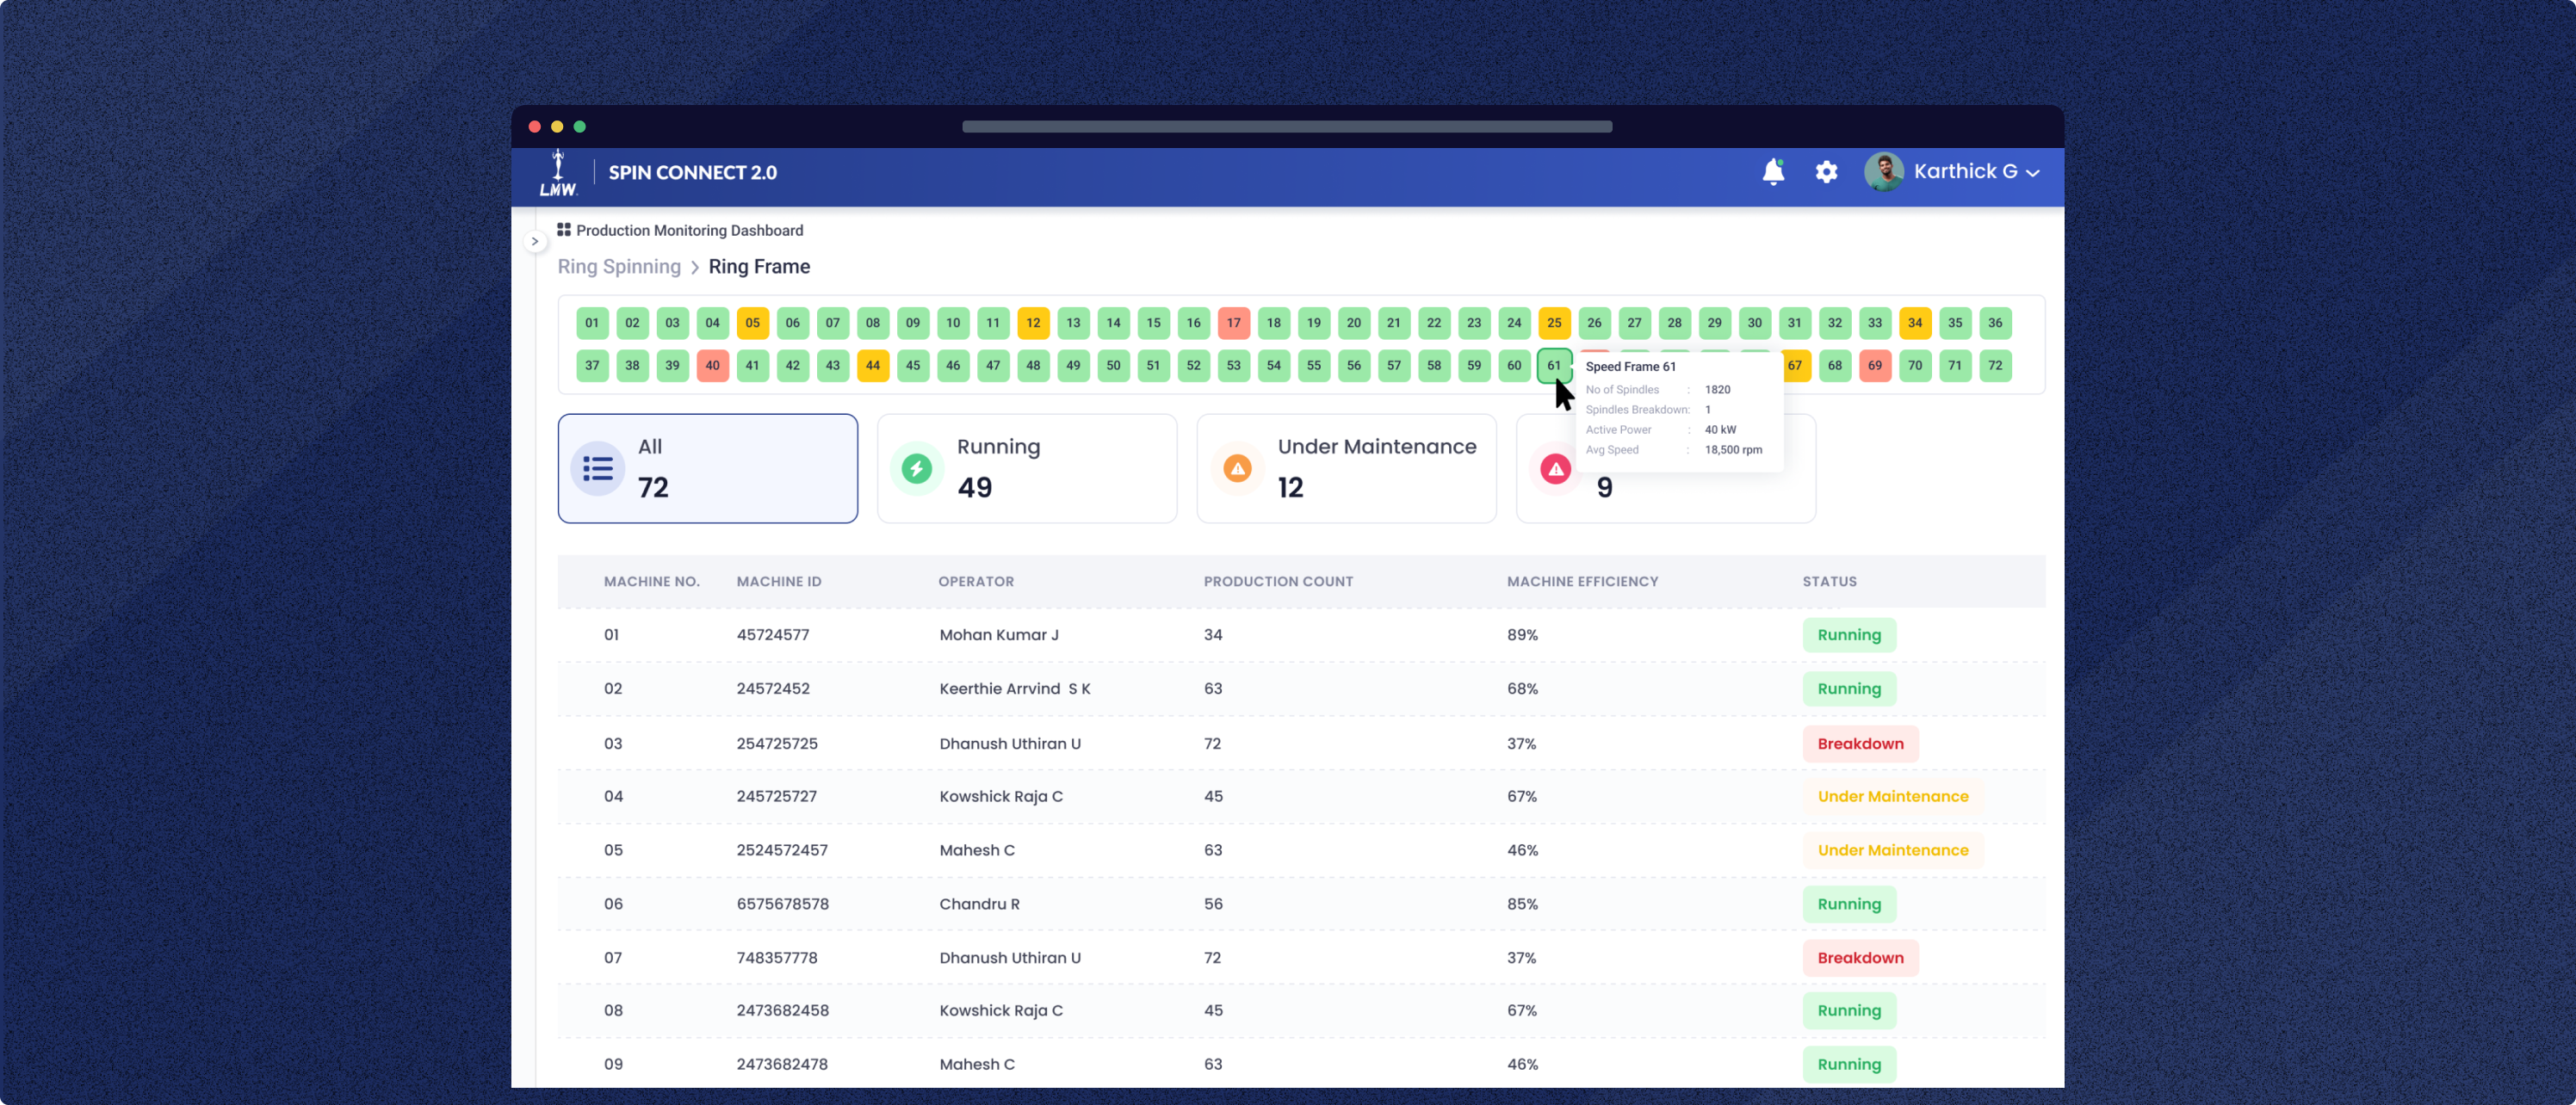
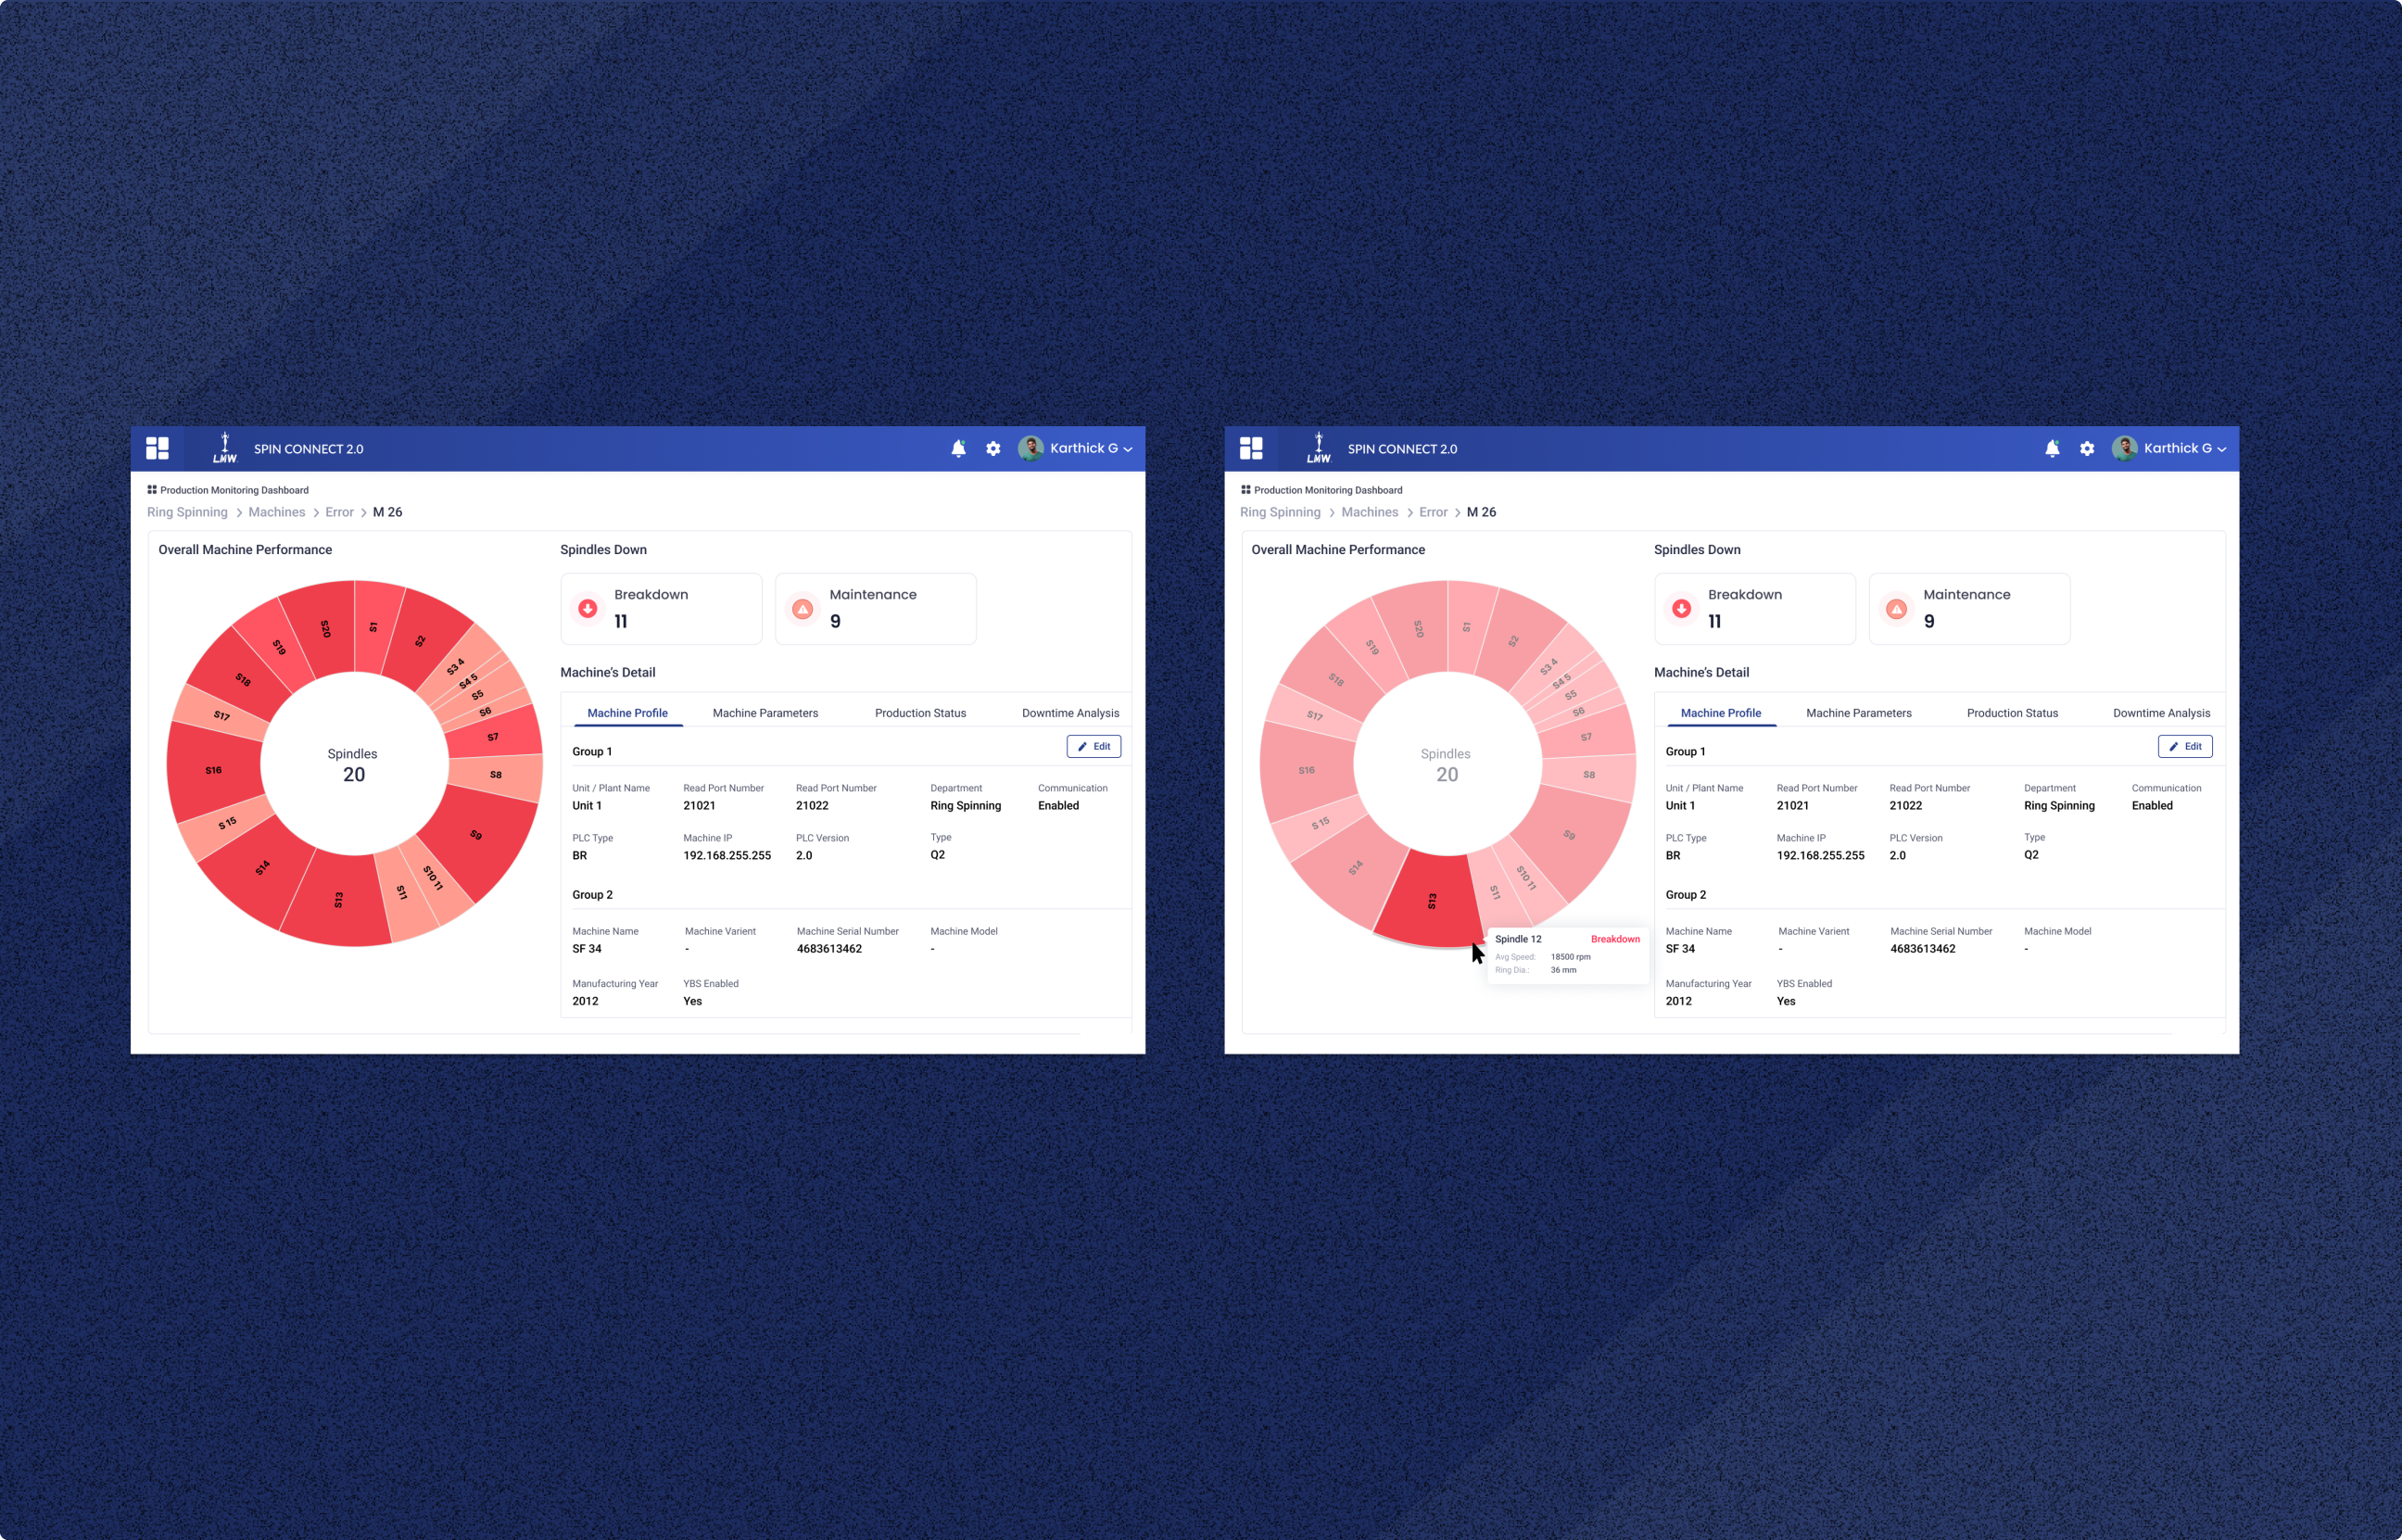
Intuitive Dashboard & Real-Time Monitoring
A key UX priority was designing a clear, insightful, and interactive dashboard that helps users monitor factory operations at a glance.
Role-based dashboard views for plant managers, production supervisors, and maintenance teams.
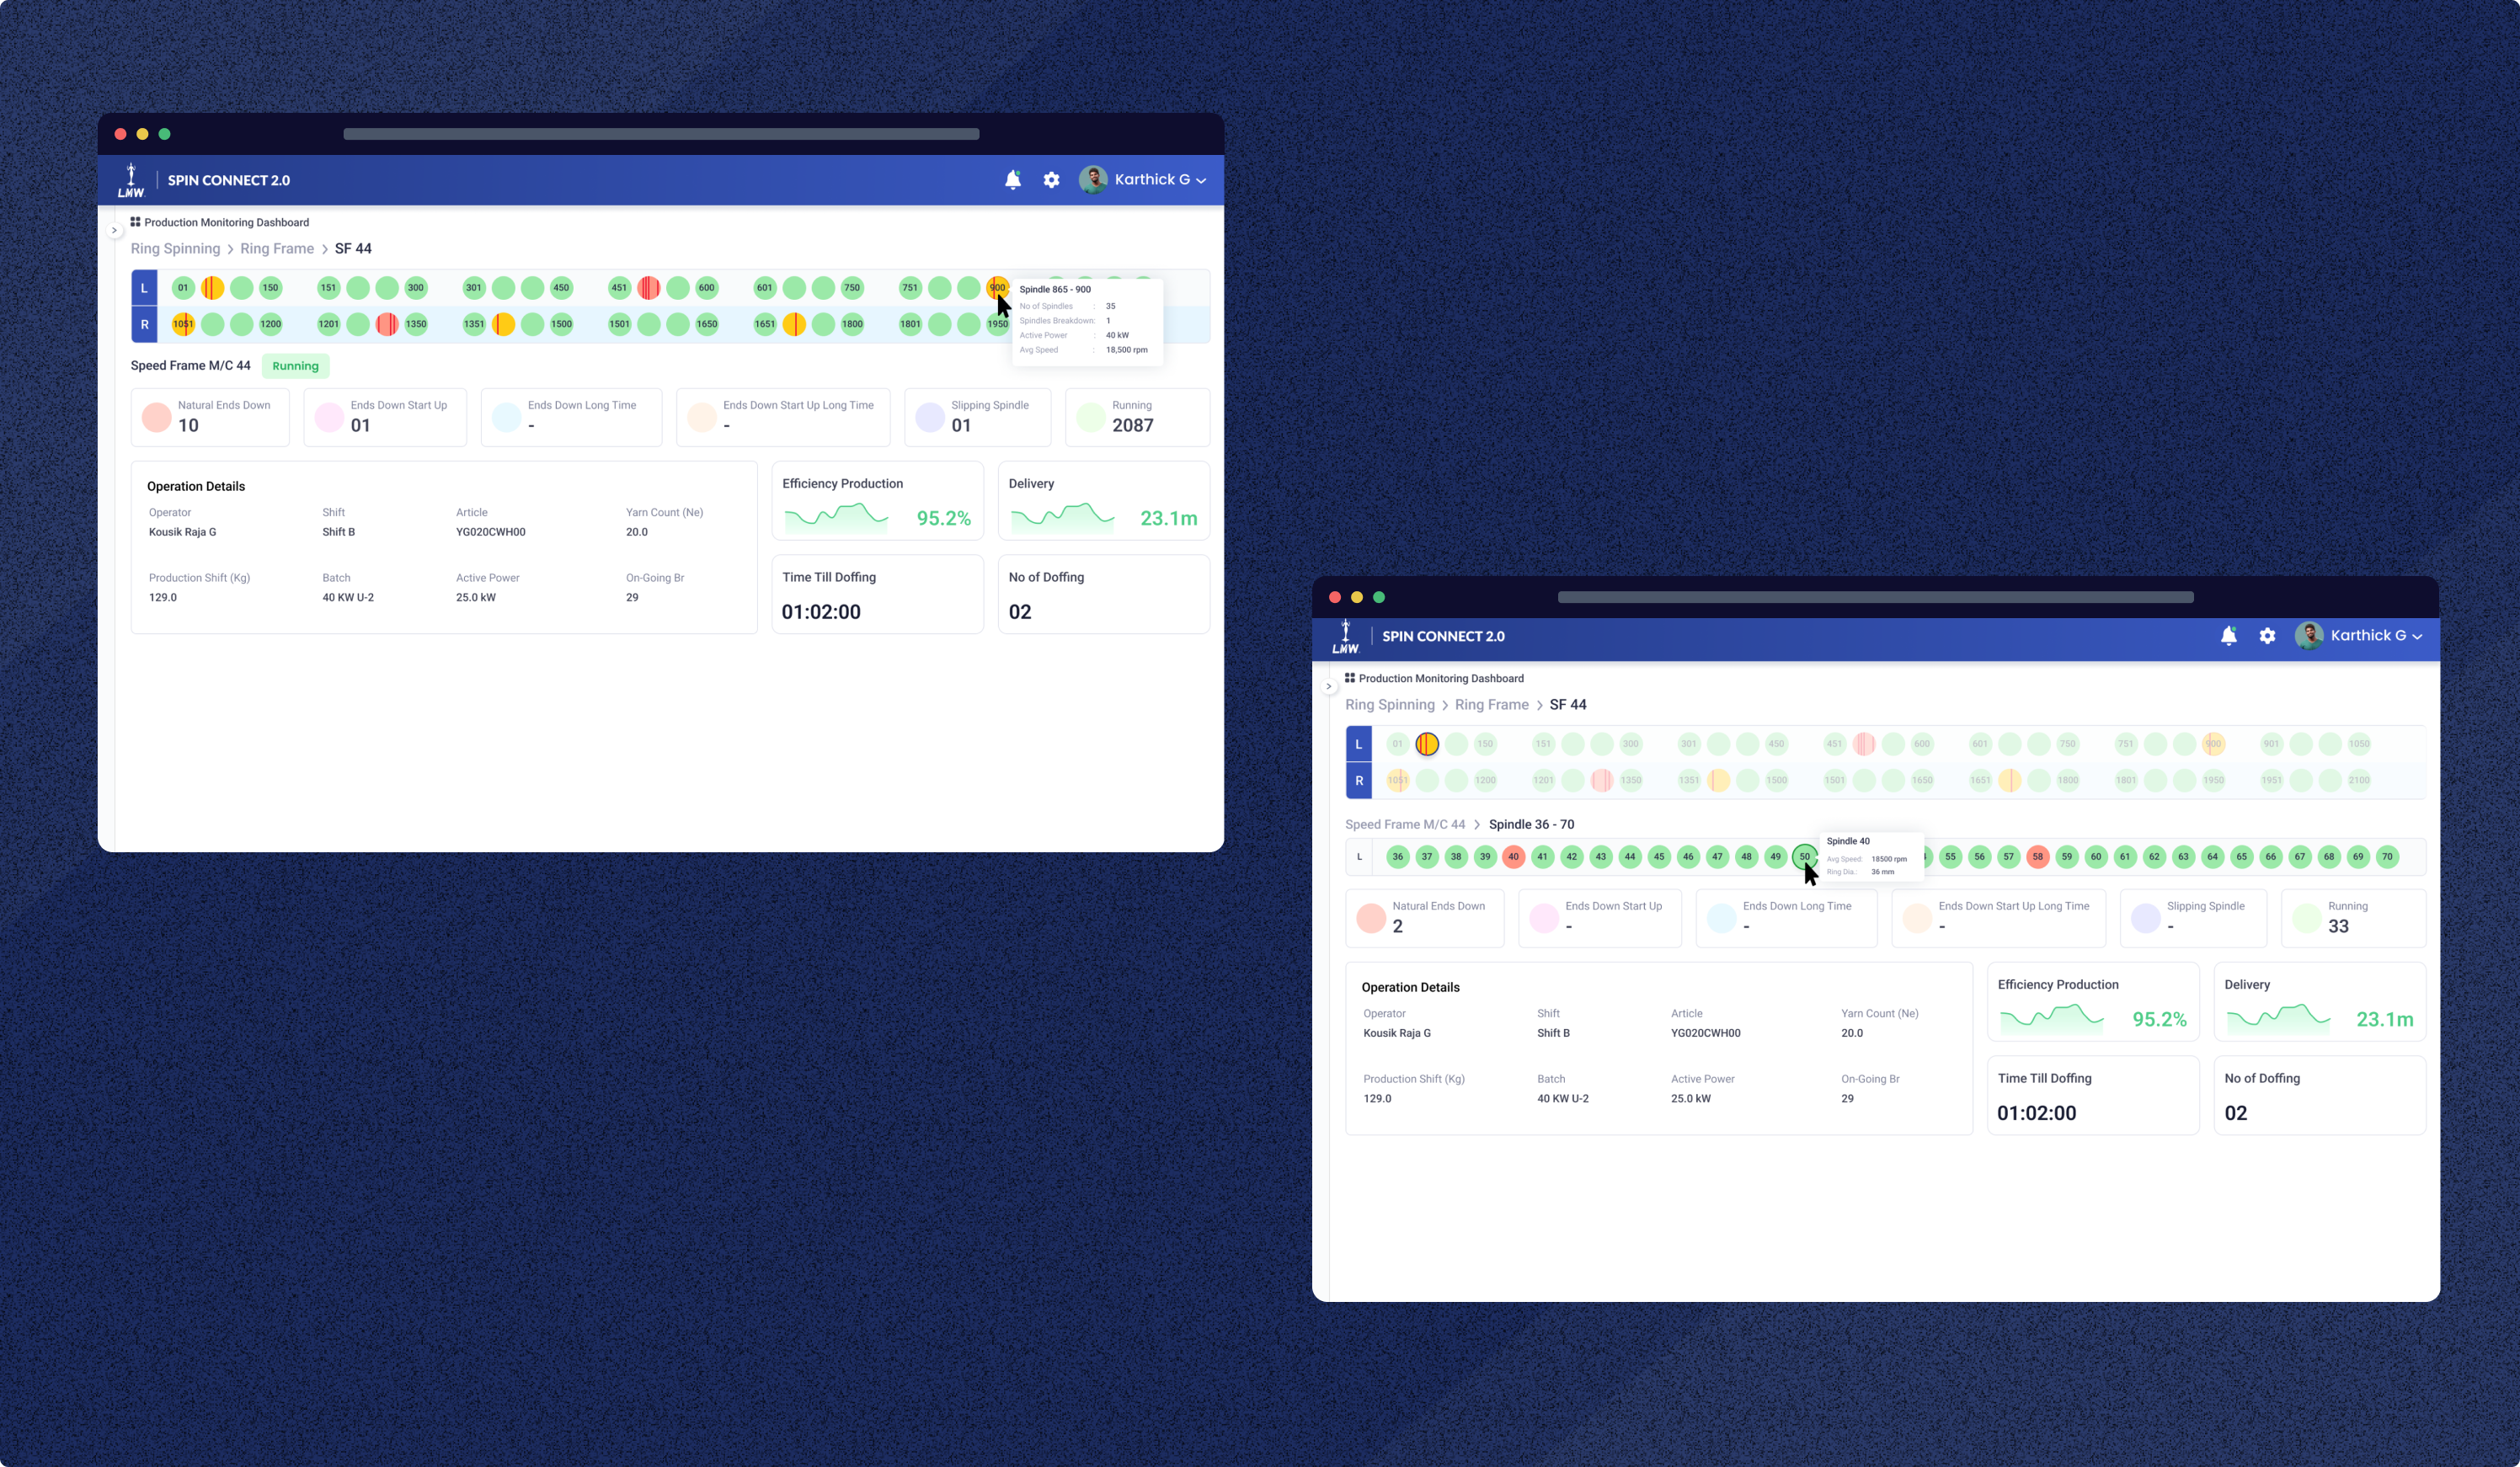
Real-time tracking of speeds, quality, production stoppages, and power consumption.
Interactive graphs & heatmaps for quick anomaly detection and efficiency analysis.
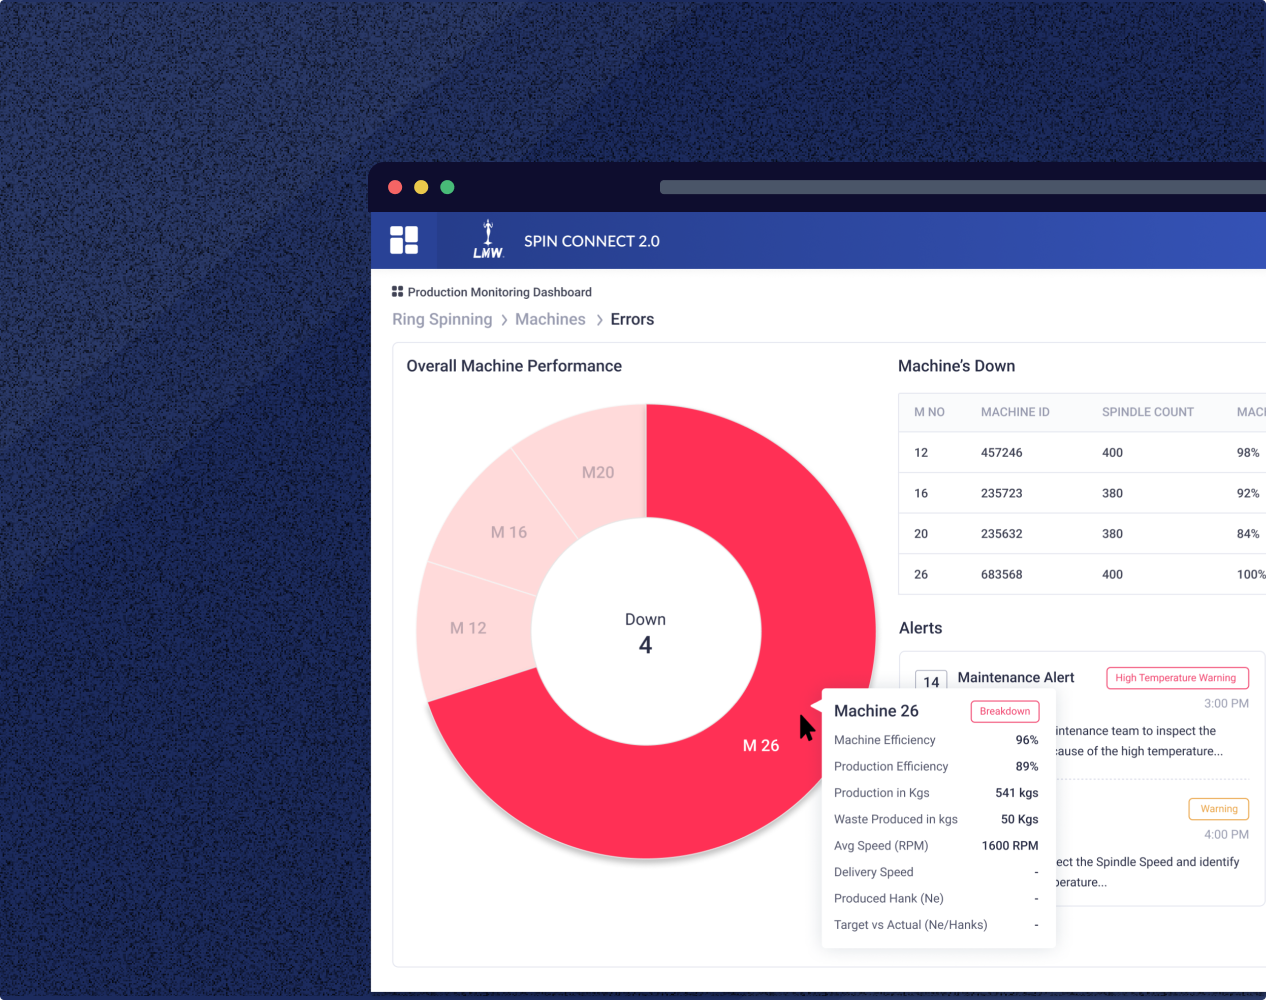
Instant alerts & notifications for critical issues, reducing downtime.
By incorporating human-centered design principles, we created a dashboard that enhances usability while delivering powerful, real-time insights.
Smart Automation & Predictive Analytics
SpinConnect 2.0 goes beyond just monitoring—it predicts inefficiencies and optimizes production.
AI-powered predictive maintenance – Detects early signs of machine failure.
Automated efficiency analysis – Identifies process bottlenecks in real time.
Intelligent alerts & recommendations – Suggests corrective actions before issues escalate.
This data-driven approach ensures that factory teams work smarter, not harder.
The Final UX Solution
Intelligent & Role-Based Monitoring System
Personalized dashboards providing relevant data for each user role.
Real-time operational insights to track speed, stoppages, and productivity.
Intuitive data visualization for better decision-making.
AI-Powered Predictive Insights & Alerts
Early fault detection to prevent breakdowns and minimize downtime.
Smart recommendations for process optimization and energy efficiency.
Custom alerts & notifications to ensure proactive issue resolution.
Seamless User Experience Across Devices
Cloud-based web application for remote monitoring.
Optimized for mobile, tablet, and desktop interfaces.
Fast, lightweight UI ensuring smooth performance across all devices.
Key UX Enhancements
Simplified, intuitive interface reducing learning curves.
Visual-first dashboards making data interpretation effortless.
Predictive analytics & AI-driven insights to optimize production.
Mobile-friendly, role-based access ensuring seamless usability.
The Impact of
UX-Driven Design
Our user-centered design approach led to:
40% Reduction in Downtime
Proactive monitoring and predictive maintenance.
30% Increase in Plant Utilization
Real-time insights driving efficiency.
Higher User Adoption Rates
Intuitive, role-specific dashboards for all levels of users.
Faster Decision-Making
Smart alerts and data visualization reducing response time.
By combining cutting-edge UX design with AI-powered analytics, SpinConnect 2.0 has revolutionized textile process monitoring and control.